Tuesday, April 17, 2007
Monday, April 16, 2007
Chatter Rankings Graphs
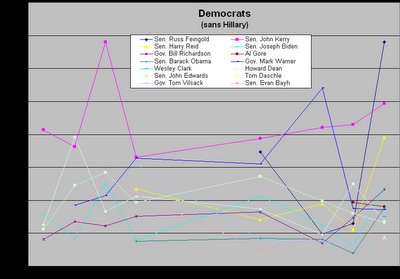
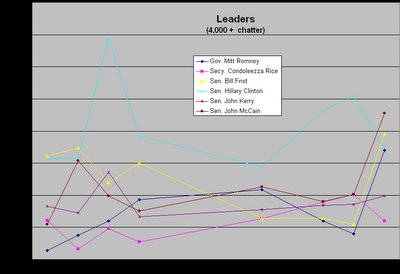
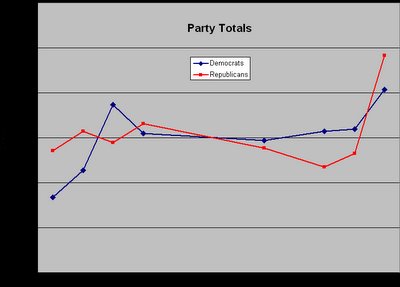
Charting the chatter for the past two years, we can see that Democrats have a decided advantage in coverage. Overall, they've gotten 58% of all the stories I've tracked; since May 2006. Coverage has shifted more towards Democrats in the past year - and has grown tremendously at the same time, spiking with the candidacy announcements in January and diminishing somewhat since then. The pace should begin to pick up in a couple months as the Iowa Straw Poll (in Ames, August 19, 2007) nears.
See the full Chatter Rankings at Global Review.


See the full Chatter Rankings at Global Review.


Wednesday, January 17, 2007
Chatter Ranking Graphs
These graphs are updated through January, 2007. For some reason, blogger blacks out the axis labels in most browsers; click on each image for a full-size version without blackout.


See
previous graphs of the past Chatter Rankings plus Chatter Rankings from January 2007, December 2006, November, October, September, August, July,
June,
May, April, March, February, December 2005, August, July, June, and May.


See
previous graphs of the past Chatter Rankings plus Chatter Rankings from January 2007, December 2006, November, October, September, August, July,
June,
May, April, March, February, December 2005, August, July, June, and May.
Thursday, November 16, 2006
New Blogs
Two more blog names for the season:
Tommy Thompson 2008
Duncan Hunter for President
All these blogs are for sale... get your candidate's site up and running today!
Tommy Thompson 2008
Duncan Hunter for President
All these blogs are for sale... get your candidate's site up and running today!
Wednesday, April 12, 2006
Chatter Ranking Graphs
Notes:
1. The graphs look smoothe between August and February; this is because I only did one Chatter Ranking (in December).
2. Sen. Hillary Clinton has been taken off the Democrats graph to correct the scale; she is literally off the charts.
3. Click on the graphs to get them to open in a new window where they will be big enough to properly view.
4. For some reason, numbers are blacked out. Refer back to the Global Review post for an idea of the scale. The x-axis is months; you can see the break in late 2005 as an area with no 'dots' along the plotted series.


